• Overview
  • FASTQ+
  • PISA
  • Yano
  • My GitHub Page
  • Discussions

Yano

Spatial dissimilarity analysis in single cells

On this page

  • Introduction
  • INSTALL
  • Get started
  • Short cases
  • Changelog
  • Issues or questions

Introduction

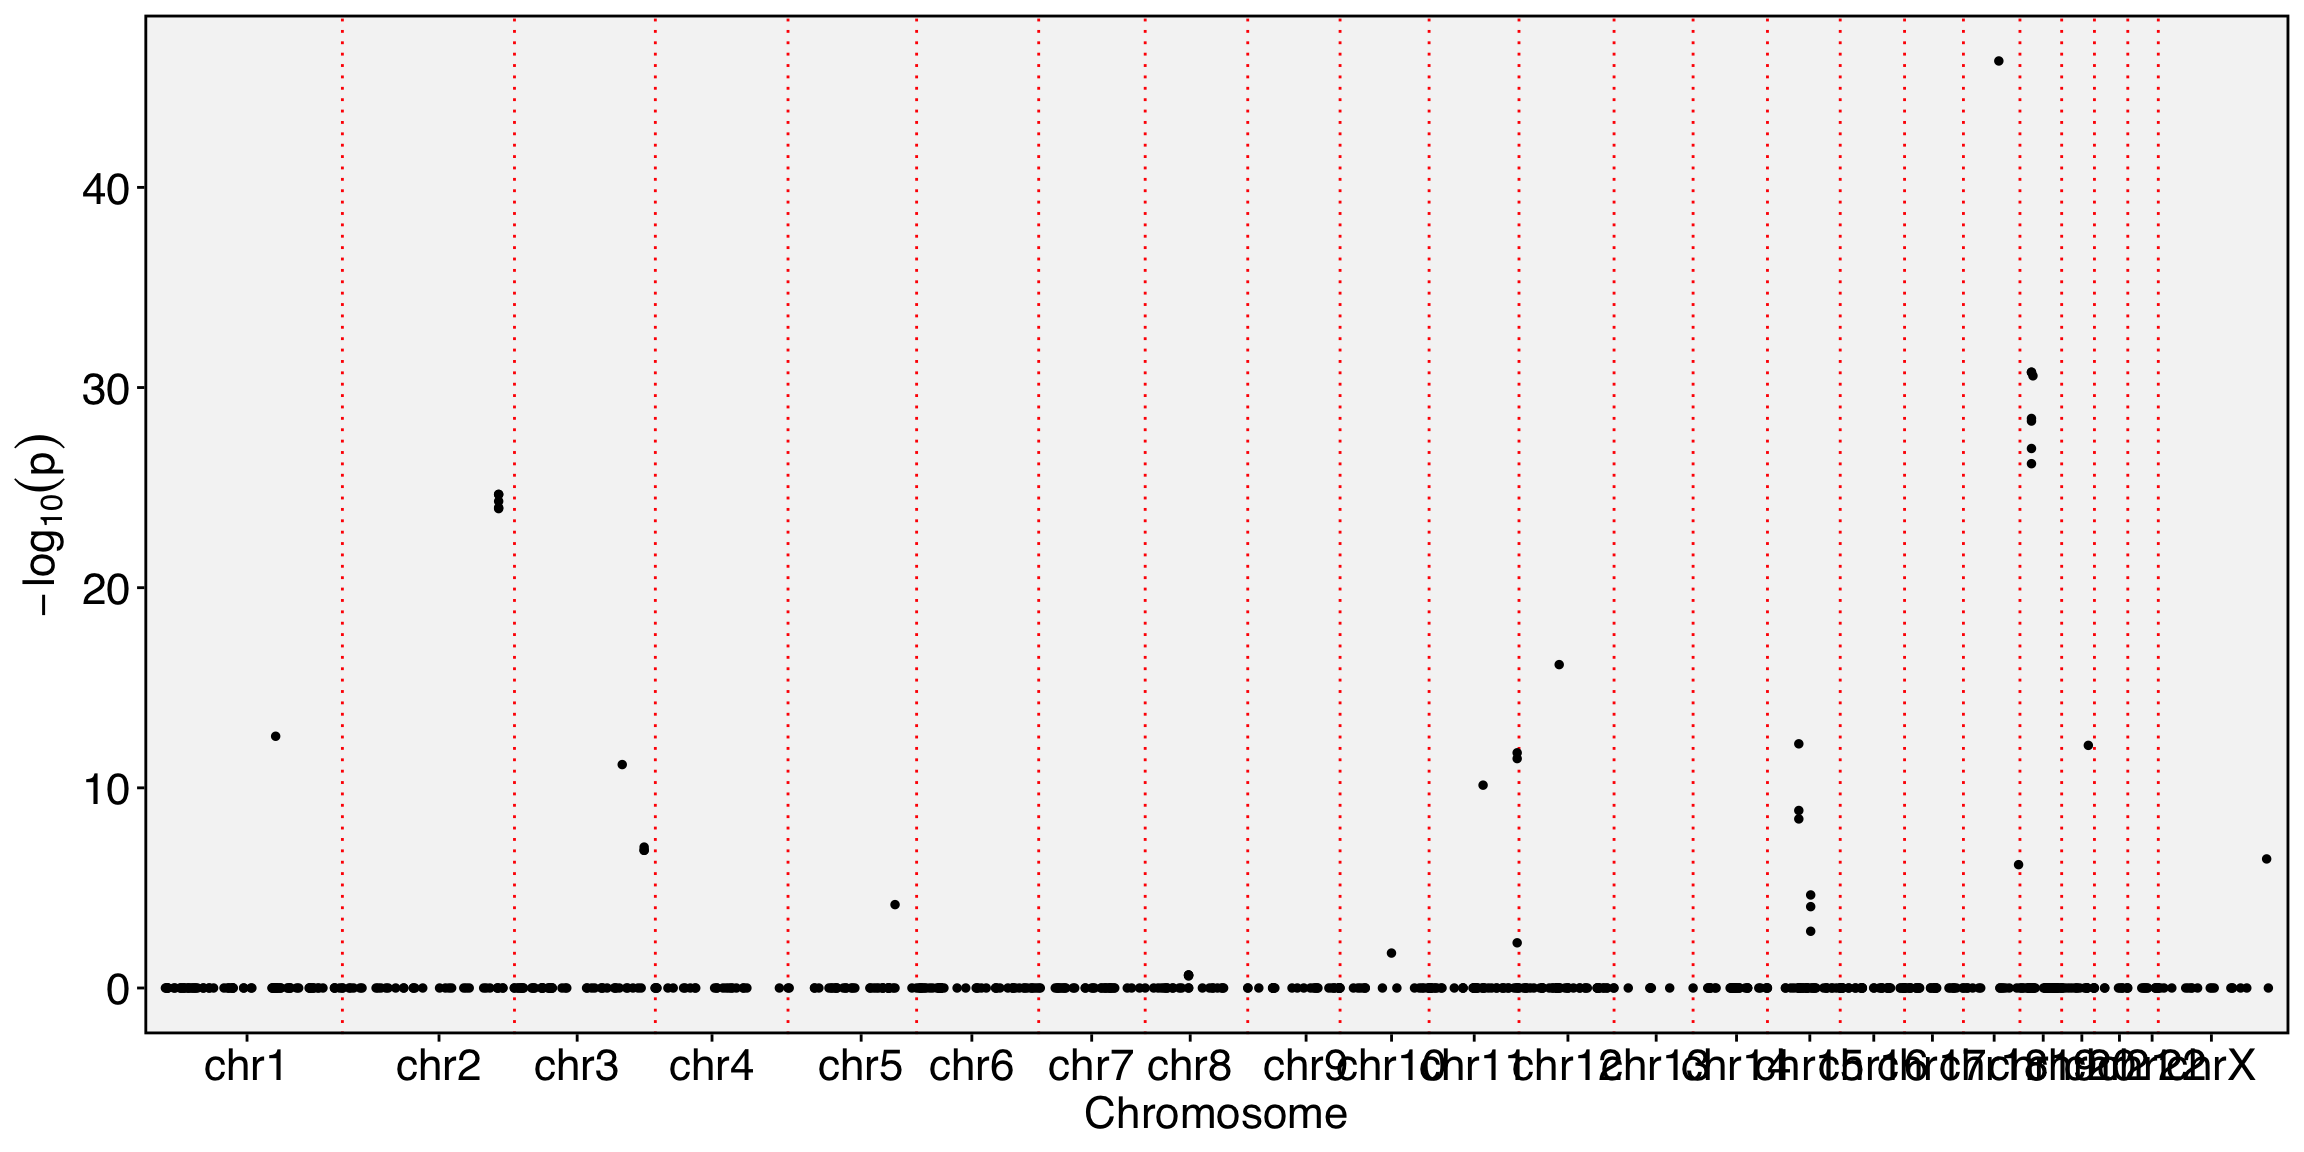
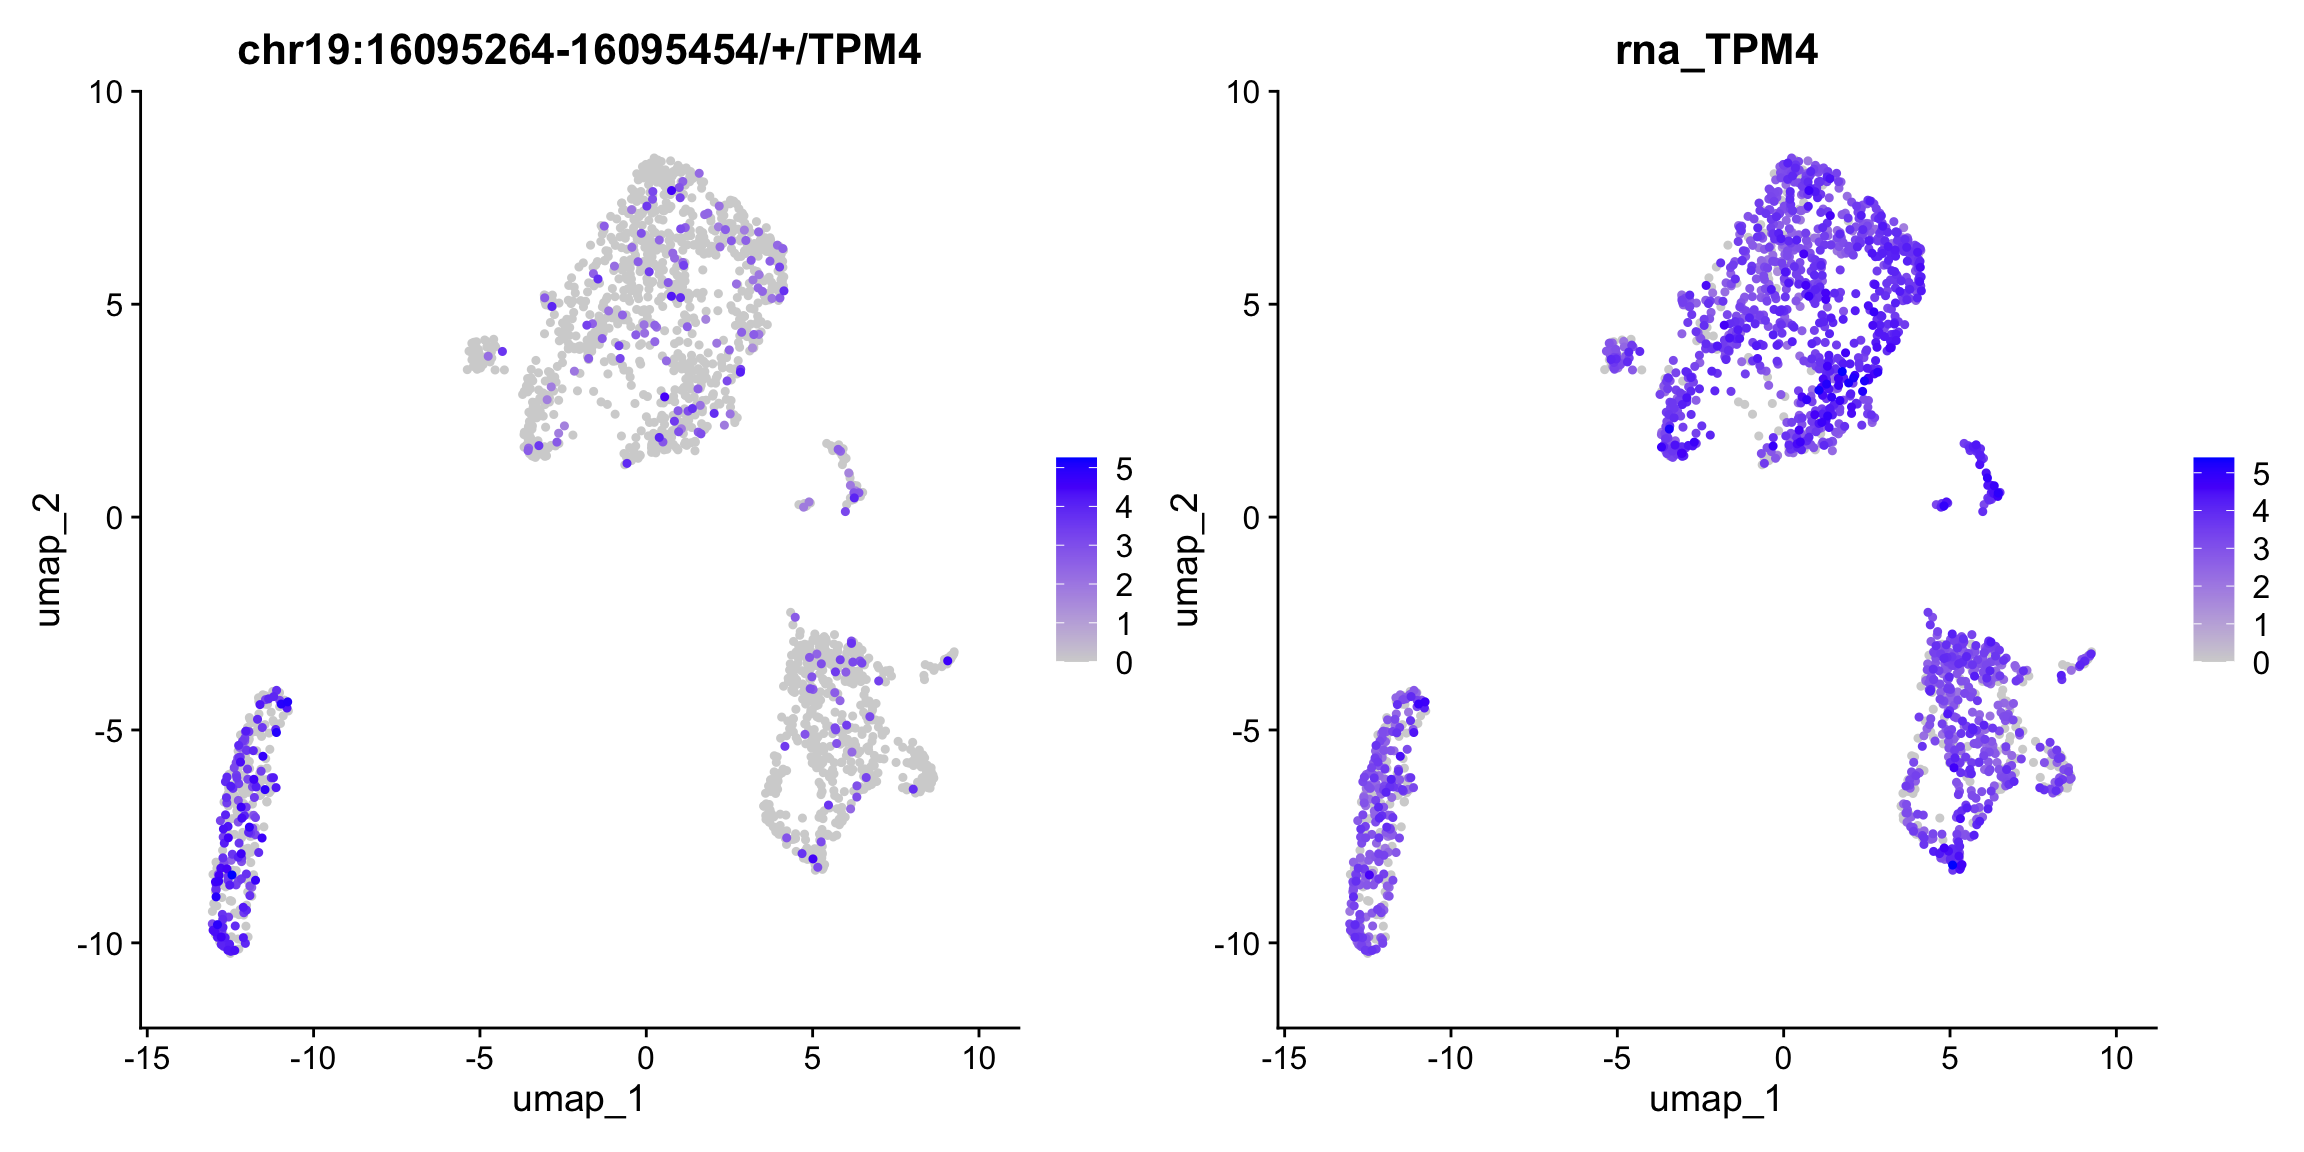
Yano represents an R/C toolkit designed for conducting spatial dissimilarity analysis on single-cell RNA sequencing data. This method revolves around the core concept of examining the distinct expression patterns of a given feature (e.g. exon, snp allele) in relation to its associated binding feature (typically a gene or another allele at the same genomic locus) within the context of cell lineage (1D), spatial position (2D), or the multi-dimensional PCA space. The discernible differences in feature expression patterns and their binding features provide insights into a range of biological phenomena, including alternative splicing, cis-antisense RNA regulation, allele-specific gene expression, and more.

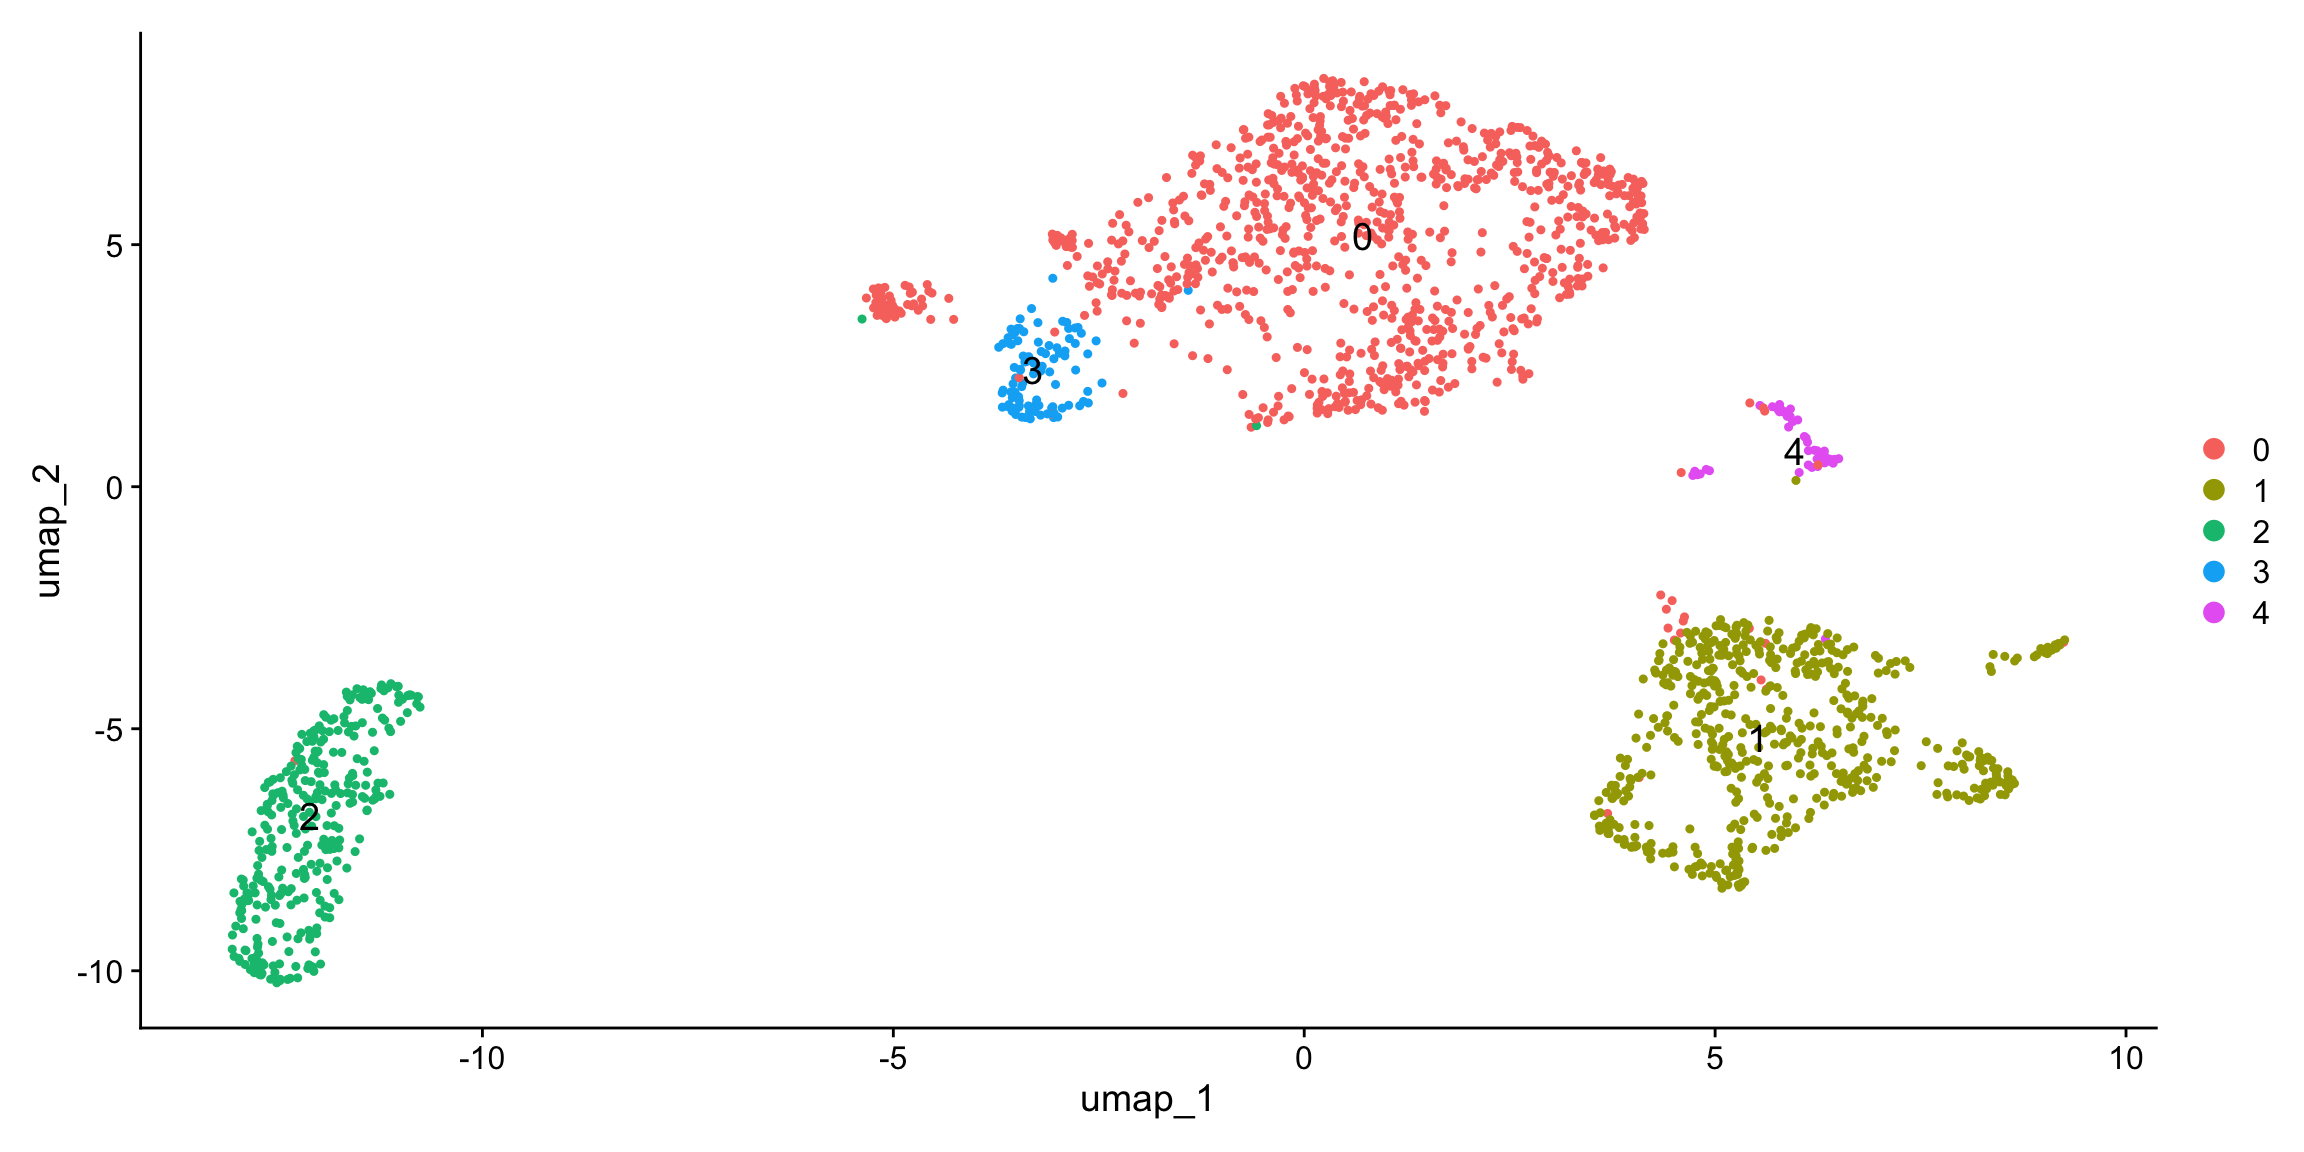
Yano is seamlessly integrated with Seurat, building upon the Seurat object’s framework. Users can perform conventional cell clustering analyses using the state-of-the-art Seurat pipeline and then incorporate exon, SNP counts as new “assays” within the Seurat objects. Subsequently, Yano facilitates the assessment of spatial dissimilarity between these two assays. For more details about the method, please refer to our manuscript.

INSTALL

if (!require("BiocManager")) install.packages('BiocManager') 
BiocManager::install("shiquan/Yano")

Notice: Multithread mode is disabled on macOS by default due to the lack of OpenMP support. The R package data.table provides a useful tutorial on how to enable OpenMP on macOS. Please refer to this guide: https://github.com/Rdatatable/data.table/wiki/Installation#enable-openmp-for-macos for more info.

Get started

To fast hand-on the Yano workflow, you could get started with the built-in dataset.

require(Seurat)
require(Yano)
data("glbt_small")
DefaultAssay(glbt_small) <- "RNA"
glbt_small <- NormalizeData(glbt_small) %>% RunUMAP(dim = 1:20)

DimPlot(glbt_small, label = TRUE, label.size = 5)

DefaultAssay(glbt_small) <- "exon"
glbt_small <- NormalizeData(glbt_small)
Meta(glbt_small) %>% head
data frame with 0 columns and 6 rows
glbt_small <- ParseExonName(glbt_small)
Meta(glbt_small) %>% head
                                    chr     start       end gene_name strand
chr1:154169305-154169383/-/TPM3    chr1 154169305 154169383      TPM3      -
chr11:35197162-35197793/+/CD44    chr11  35197162  35197793      CD44      +
chr11:75421727-75422280/+/RPS3    chr11  75421727  75422280      RPS3      +
chr11:123060825-123061329/-/HSPA8 chr11 123060825 123061329     HSPA8      -
chr11:123061588-123061833/-/HSPA8 chr11 123061588 123061833     HSPA8      -
chr11:123061869-123062022/-/HSPA8 chr11 123061869 123062022     HSPA8      -
grep("_wm$",names(glbt_small), value=TRUE)
character(0)
glbt_small <- RunAutoCorr(glbt_small)
grep("_wm$",names(glbt_small), value=TRUE)
[1] "pca_wm"
# Perform spatial dissimilarity test
glbt_small <- RunSDT(glbt_small, bind.name = "gene_name", bind.assay = "RNA")
Meta(glbt_small) %>% head
                                    chr     start       end gene_name strand
chr1:154169305-154169383/-/TPM3    chr1 154169305 154169383      TPM3      -
chr11:35197162-35197793/+/CD44    chr11  35197162  35197793      CD44      +
chr11:75421727-75422280/+/RPS3    chr11  75421727  75422280      RPS3      +
chr11:123060825-123061329/-/HSPA8 chr11 123060825 123061329     HSPA8      -
chr11:123061588-123061833/-/HSPA8 chr11 123061588 123061833     HSPA8      -
chr11:123061869-123062022/-/HSPA8 chr11 123061869 123062022     HSPA8      -
                                   moransi.pval    moransi autocorr.variable
chr1:154169305-154169383/-/TPM3   2.145482e-108 0.09755124              TRUE
chr11:35197162-35197793/+/CD44     0.000000e+00 0.25567534              TRUE
chr11:75421727-75422280/+/RPS3     4.384004e-38 0.05692909              TRUE
chr11:123060825-123061329/-/HSPA8  1.099318e-63 0.07462142              TRUE
chr11:123061588-123061833/-/HSPA8 7.646557e-158 0.11891354              TRUE
chr11:123061869-123062022/-/HSPA8 1.467547e-150 0.11541279              TRUE
                                  gene_name.D gene_name.t gene_name.pval
chr1:154169305-154169383/-/TPM3     0.3298889  -8.8300031   1.939628e-14
chr11:35197162-35197793/+/CD44      0.1582675  -0.8945946   1.865868e-01
chr11:75421727-75422280/+/RPS3      0.2748901  -9.4219413   9.979379e-16
chr11:123060825-123061329/-/HSPA8   0.2343256  -8.3896002   1.743493e-13
chr11:123061588-123061833/-/HSPA8   0.3323525 -16.1348177   9.062215e-30
chr11:123061869-123062022/-/HSPA8   0.3224089 -11.4810464   3.333490e-20
                                  gene_name.padj
chr1:154169305-154169383/-/TPM3     6.585918e-13
chr11:35197162-35197793/+/CD44      1.000000e+00
chr11:75421727-75422280/+/RPS3      3.727298e-14
chr11:123060825-123061329/-/HSPA8   5.662563e-12
chr11:123061588-123061833/-/HSPA8   1.105028e-27
chr11:123061869-123062022/-/HSPA8   1.660078e-18
# Manhattan plot for spatial dissimilarity test result
FbtPlot(glbt_small, val = "gene_name.padj")

FeaturePlot(glbt_small, features = c("chr19:16095264-16095454/+/TPM4", "TPM4"), order=TRUE)

# Track plot for gene coverage at different cell types
db <- gtf2db("./gencode.v44.annotation.gtf.gz")
[2026-06-15 15:06:22] GTF loading..
[2026-06-15 15:06:52] Load 62700 genes.
[2026-06-15 15:06:52] Load time : 29.649 sec
TrackPlot(bamfile="./Parent_SC3v3_Human_Glioblastoma_possorted_genome_bam.bam", gtf =db, gene = "TPM4", junc = TRUE, cell.group = Idents(glbt_small), highlights = c(16095264,16095454))

See short cases for more details.

Short cases

  • Alternative splicing analysis for scRNA-seq
  • Allele-specific gene expression analysis for scRNA-seq
  • Annotating and prioritizing genetic variants for scRNA-seq
  • Perform alternative splicing analysis for multiple Visium samples
  • Select cells from reduction maps
  • Perform alternative splicing analysis for cell trajectory and user-defined embeddings

Changelog

1.5 2026/06/15
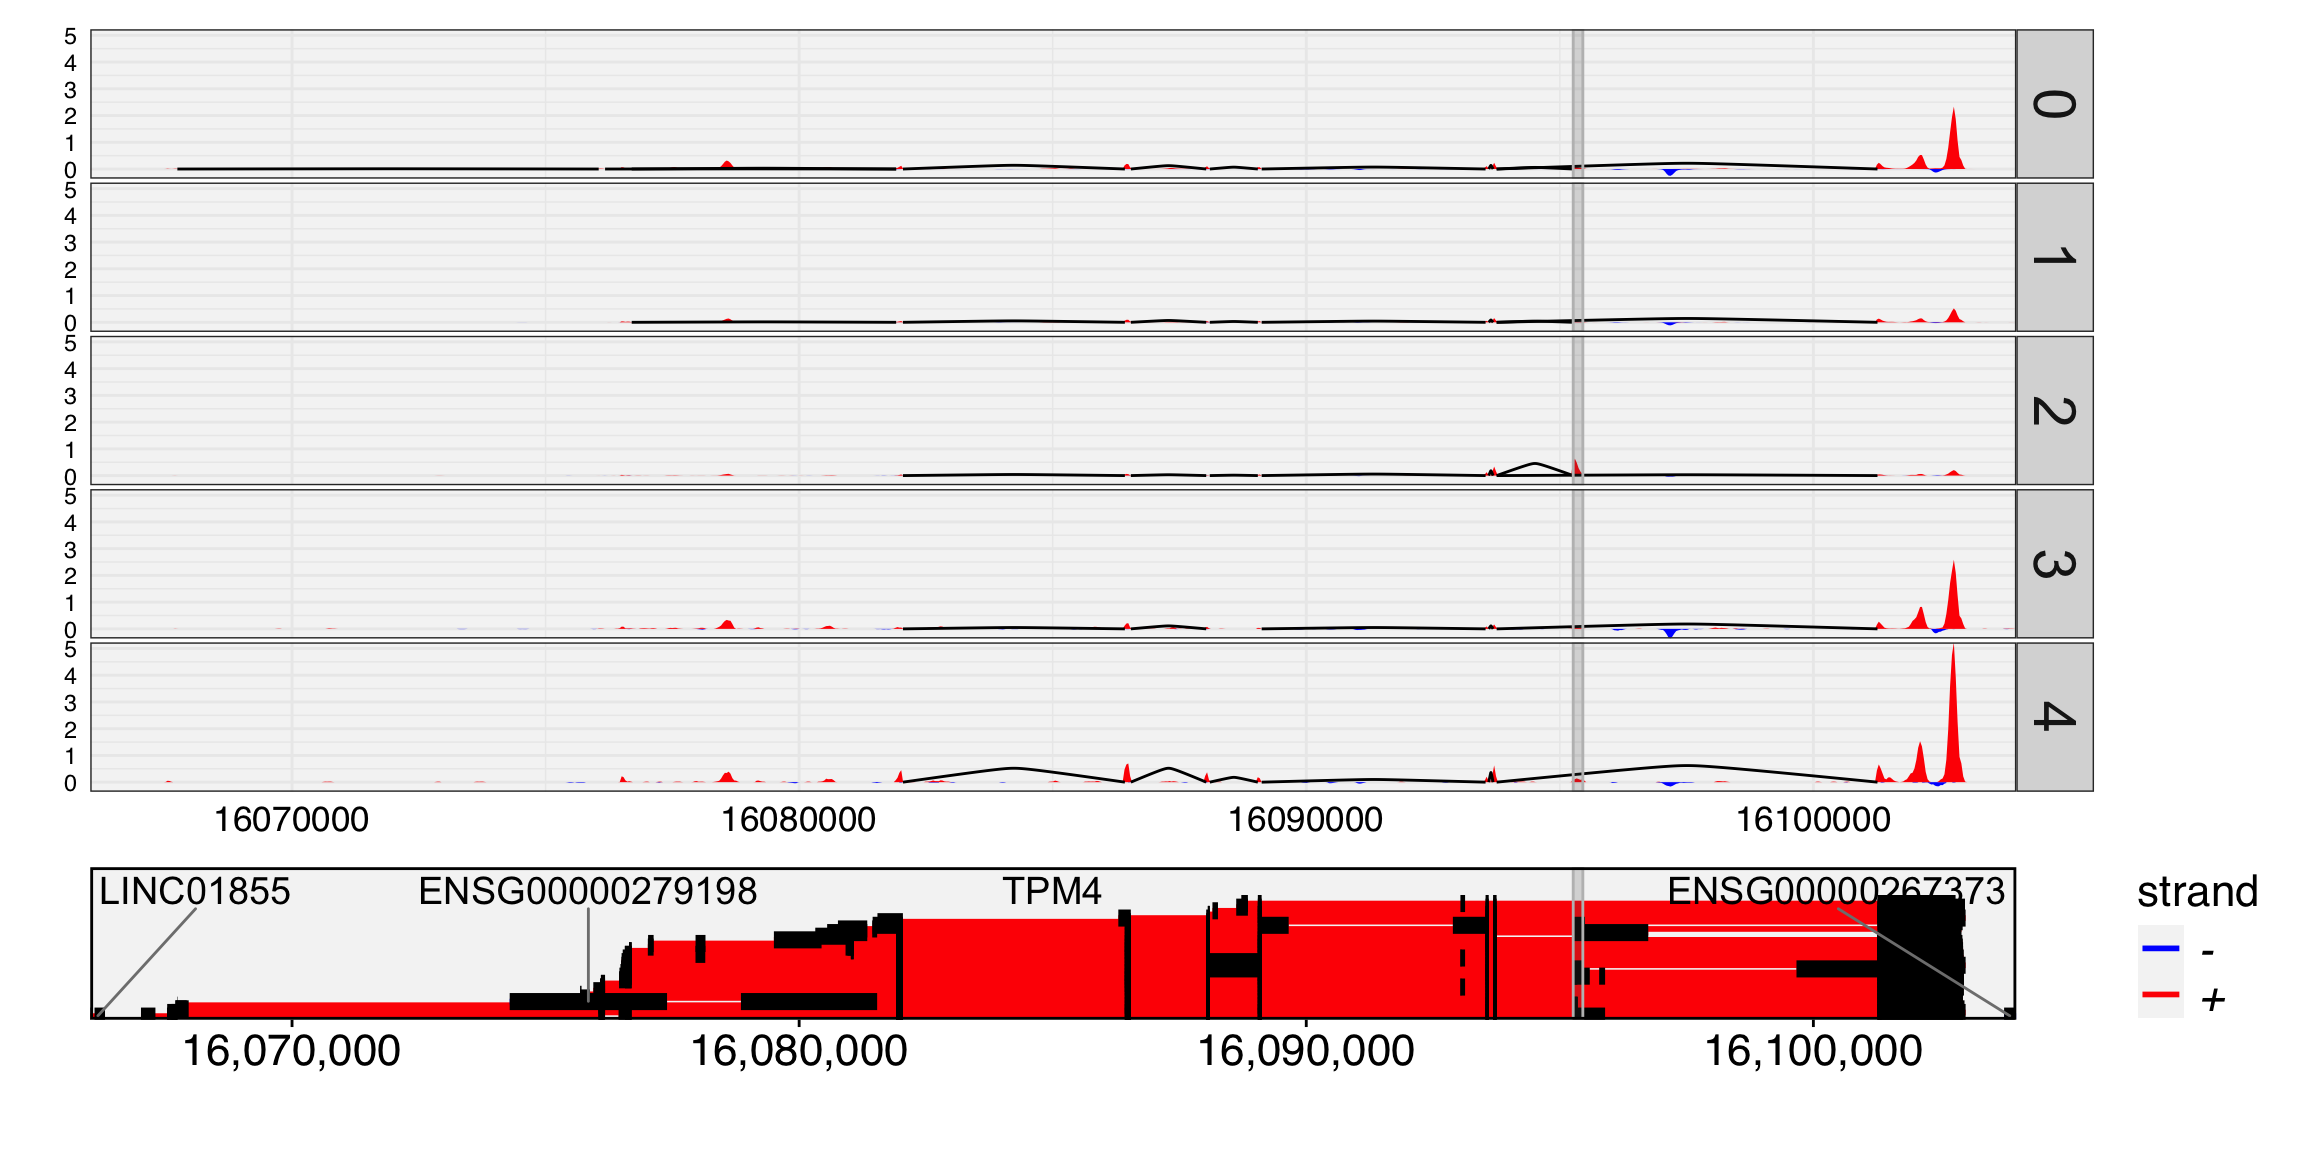
  • Rewrite TrackPlot() highlight rendering with grid primitives (rectGrob + segmentsGrob) for cross-track spanning. Highlights now span continuously across all facet panels and tracks (coverage, BED, gene annotation) with visual protrusion. Multiple overlapping highlights use additive alpha blending with dark orange boundary lines.
  • CRAN preparation: fix examples, NAMESPACE, DESCRIPTION metadata, and documentation issues. Register native routines (src/init.c) for CRAN compliance.
  • Add gtable to Imports, systemfonts to Suggests, remove unused R.utils.
  • New S3 methods: print.TrackPlot and grid.draw.TrackPlot.
  • Fix combined & theme() assignment bug and data.frame highlights parsing.
  • Update README with package overview and key capabilities.
  • Updated vignette for grid-based highlights; rendered all documentation with Quarto.
1.4 2026/06/11
  • New functions: GetWeightsFromCoords(), GetWeightsFromSNN() for flexible weight matrix construction.
  • Improve TrackPlot() highlight continuity and y-axis label readability.
  • Harden weights.R with input validation and boundary checking.
  • Update LICENSE to Yano authors (2023–2026).
1.3 2026/06/05
  • Update citation from bioRxiv to Cell Reports Methods.
  • Rewrite D_test_v2 with dense arrays: remove cholmod critical section, improved performance.
  • New functions: GetWeightsFromSpatial(), QuickRecipe(), QuickRecipe0().
  • Remove deprecated functions: FindDEP(), RunDLScore().
  • Fix Fisher–Yates shuffle implementation in correlation tests.
  • Add match.arg validation for mode parameter in RatioPlot0() and RatioPlot().
  • Comprehensive C and R bug fixes and code hardening.
  • Build system: downgrade htslib to 1.10.2 for compatibility, add -fPIC support.
1.2 2025/06/18
  • Rename RunBlockCorr to RunSDT.
  • Reimplement core algorithm with sparse matrix structure. Highly improved speed (>3x).
1.1 2025/06/02

Simplified parameters for RunCorrBlock() to streamlines the function and makes it more concise. In addition, new selector functions, *Selector(), introduced.

1.0 2025/02/19

First stable release.

0.0.0.9999 2023/03/22

Init version.

Issues or questions

  • https://github.com/shiquan/Yano/issues
  • https://github.com/shiquan/Yano/discussions
Back to top